Market Outlook
November 08, 2016
Market Cues
Domestic Indices
Chg (%)
(Pts)
(Close)
Indian markets are likely to open positive backed by SGX nifty and Down Jones
BSE Sensex
0.7
185
27,459
which remained active and gained strongly overnight.
Nifty
0.8
63
8,497
Mid Cap
0.6
75
12,915
U.S. markets edged up and closed strong a day ahead of Election Day Political
Small Cap
1.2
153
13,030
worries eased after the FBI said its fresh review of Hillary Clintons emails won’t lead
to charges, triggering a global rally in equities.
Bankex
1.7
371
22,151
Indian markets bounced back sharply backed by global rally in the equity markets
Global Indices
Chg (%)
(Pts)
(Close)
and as probability of Hillary Clintons wins increased. While back home key
important banks like ICICI were expected to declare their 2nd quarter results, market
Dow Jones
2.1
371
18,260
participants seems to be more keenly watching global developments than the
Nasdaq
2.4
120
5166
domestic developments.
FTSE
1.7
113
6,807
Nikkei
1.6
272
17,177
Result Review
Hang Seng
0.7
159
22,801
Lupin Q2FY17
ICICI Bank’s 2QFY17 Results in line with expectations
Shanghai Com
0.3
8
3,133
Detailed analysis on Pg2
Advances / Declines
BSE
NSE
Investor’s Ready Reckoner
Advances
2,047
1189
Key Domestic & Global Indicators
Declines
865
446
Stock Watch: Latest investment recommendations on 150+ stocks
Unchanged
118
59
Refer Pg6 onwards
Top Picks
Volumes (` Cr)
CMP
Target
Upside
Company
Sector
Rating
BSE
3,204
(`)
(`)
(%)
Amara Raja Batteries Auto & Auto Ancill.
Buy
1,016
1,218
19.9
NSE
21,403
HCL Tech
IT
Buy
815
1,000
22.7
Asian Granito
Capital Goods
Buy
264
351
32.8
Net Inflows (` Cr)
Net
Mtd
Ytd
Equitas Holdings
Financials
Buy
171
235
37.5
FII
493
(144)
44,870
Navkar Corporation Others
Buy
198
265
33.8
MFs
107
287
22,339
More Top Picks on Pg4
Key Upcoming Events
Top Gainers
Price (`)
Chg (%)
Previous
Consensus
Date
Region
Event Description
Reading
Expectations
Crompgreav
86
12.2
Nov 08 China
Exports YoY%
(10.00)
(5.80)
Lupin
1,519
6.9
Nov 08 UK
Industrial Production (YoY)
0.70
0.80
Sreinfra
83
6.6
Nov 09 US
Initial Jobless claims
265.00
260.00
Pnb
140
6.6
Nov 10 China
Consumer Price Index (YoY)
1.90
2.10
Hindalco
168
5.9
Nov 10 India
Imports YoY%
(2.50)
Nov 10 China
Industrial Production (YoY)
6.10
6.20
6.(
More Events on Pg5
Top Losers
Price (`)
Chg (%)
Gppl
161
(3.8)
Tubeinvest
615
(3.3)
Rallis
203
(2.9)
Shreecem
16,348
(2.7)
Sjvn
30
(2.6)
As on November 07, 2016
Market Outlook
November 08, 2016
Result Review
Lupin (CMP: `1,519 / TP:`1,809 /Upside:19.1%)
Lupin, is expected to post sales of `4,300cr , registering a yoy growth of 35.3%,
mainly aided by exports. On operating front, the EBITDA margins are expected to
come in at 24.3% V/s 16.6% in 2QFY2016. Consequently, Adj. PAT is expected to
come in at `782.1cr V/s `408.5cr in 2QFY2016, yoy growth of 91.5%. We
maintain our buy rating on the stock.
Y/E
Sales OPM
PAT
EPS ROE P/E P/BV EV/EBITDA EV/Sales
March
(` cr)
(%)
(` cr)
(`)
(%)
(x)
(x)
(x)
(x)
FY2017E
15,912
26.4
2,611
58.1
21.4
27.2
5.3
16.9
4.5
FY2018E
18,644
26.7
3,117
69.3
20.9
22.8
4.3
13.7
3.7
Reduction in watch list by ICICI Bank in line with expectations:
Slippages though remained high for ICICI Bank, it came from the know accounts
and that’s a key development during the quarter. Slippages of `8,000 cr was in
line with what we were expecting. Though in absolute terms, slippages looks still
high, the good news is that ~80% of the slippages has come from the watch list
and restructured book.
The fact that slippages from the regular loan book have been contained low is a
positive sign and key development for the quarter. While next quarters the
slippages and credit cost will remain high, going by the current quarter it seems
the bank will be largely be able to clean up the book and start looking at regular
growth from 2HFY18. While things are falling in place for ICICI Bank, due to run
up in the stock we would wait for opportune time to enter the stock. We maintain
NEUTRAL Rating on the stock.
Economic and Political News
Theresa May visit: India, UK to sign over `8,300 cr deals.
Britain asks India to speed up Cairn, Vodafone arbitration
Hotel Industry warns tourism will suffer at 18% GST
Corporate News
Allahabad Bank Q2FY17 PAT dips 63% to `65cr.
Titan’s net up 24% to Rs 181 cr on improved jewellery sales
Crompton Greaves has said it has received a binding offer for acquisition of
its B2B automation business from Alfanar
JLR October sales up 11%
Future retail acquires Heritage Food’s small stores business
Market Outlook
November 08, 2016
Quarterly Bloomberg Brokers Consensus Estimate
Ashok Leyland Ltd - Nov 8, 2016
Particulars ( ` cr)
2QFY17E
2QFY16
y-o-y (%)
1QFY17
q-o-q (%)
Net sales
4,205
4,879
(13.8)
4,176
0.7
EBITDA
422
594
(29.0)
476
(11.4)
EBITDA margin (%)
10.0
12.2
11.4
Net profit
196
292
(32.7)
291
(32.5)
Bharat Forge Ltd - Nov 8, 2016
Particulars ( ` cr)
2QFY17E
2QFY16
y-o-y (%)
1QFY17
q-o-q (%)
Net sales
996
1,092
(8.8)
889
12.1
EBITDA
289
321
(10.1)
244
18.2
EBITDA margin (%)
29.0
29.4
27.5
Net profit
157
175
(10.3)
122
28.6
Bharat Heavy Electricals Ltd - Nov 8, 2016
Particulars ( ` cr)
2QFY17E
2QFY16
y-o-y (%)
1QFY17
q-o-q (%)
Net sales
4,597
5,835
(21.2)
5,523
(16.8)
EBITDA
(198)
(474)
0.0
71
0.0
EBITDA margin (%)
(4.3)
(8.1)
1.3
Net profit
(90)
(205)
0.0
78
0.0
Lupin Ltd Consol - Nov 9, 2016
Particulars ( ` cr)
2QFY17E
2QFY16
y-o-y (%)
1QFY17
q-o-q (%)
Net sales
4,423
3,178
39.2
4,314
2.5
EBITDA
1,372
672
104.2
1,308
4.9
EBITDA margin (%)
31.0
21.1
30.3
Net profit
793
409
93.9
882
(10.1)
Rural Electrification Corp Ltd - Nov 9, 2016
Particulars ( ` cr)
2QFY17E
2QFY16
y-o-y (%)
1QFY17
q-o-q (%)
Net sales
2,220
5,893
(62.3)
5,954
(62.7)
EBITDA
2,350
5,755
(59.2)
5,510
(57.4)
EBITDA margin (%)
105.9
97.7
92.5
Net profit
1,290
1,619
(20.3)
1,421
(9.2)
Power Grid Corp of India Ltd - Nov 9, 2016
Particulars ( ` cr)
2QFY17E
2QFY16
y-o-y (%)
1QFY17
q-o-q (%)
Net sales
5,815
4,918
18.2
6,120
(5.0)
EBITDA
5,192
4,318
20.2
5,420
(4.2)
EBITDA margin (%)
89.3
87.8
88.6
Net profit
1,614
1,448
11.5
1,802
(10.4)
Market Outlook
November 08, 2016
Top Picks ★★★★★
Large Cap
Market Cap
CMP
Target
Upside
Company
Rationale
(` Cr)
(`)
(`)
(%)
To outpace battery industry growth due to better technological
Amara Raja Batteries
17,346
1,016
1,218
19.9
products leading to market share gains in both the
automotive OEM and replacement segments.
The stock is trading at attractive valuations and is factoring all
HCL Tech
1,14,948
815
1,000
22.7
the bad news.
Back on the growth trend, expect a long term growth of 14%
Infosys
2,24,813
979
1,249
27.6
to be a US$20bn in FY2020.
Source: Company, Angel Research
Mid Cap
Market Cap
CMP
Target
Upside
Company
Rationale
(` Cr)
(`)
(`)
(%)
We expect the company would report strong profitability
Asian Granito
796
264
351
32.8
owing to better product mix, higher B2C sales and
amalgamation synergy.
Among the top 4 players in the consumer durables segment.
Bajaj Electricals
2,518
249
306
22.8
Improved profitability backed by turn around in E&P segment.
Strong order book lends earnings visibility.
Favourable outlook for the AC industry to augur well for
Cooling products business which is out pacing the market
Blue Star
5,153
540
634
17.3
growth. EMPPAC division's profitability to improve once
operating environment turns around.
With a focus on the low and medium income (LMI) consumer
Dewan Housing Finance
9,773
312
350
12.1
segment, the company has increased its presence in tier-II &
III cities where the growth opportunity is immense.
Strong loan growth backed by diversified loan portfolio and
Equitas Holdings
5,730
171
235
37.5
adequate CAR. ROE & ROA likely to remain decent as risk of
dilution remains low. Attractive valuations considering growth.
Economic recovery to have favourable impact on advertising
& circulation revenue growth. Further, the acquisition of a
Jagran Prakashan
6,092
186
225
20.7
radio business (Radio City) would also boost the company's
revenue growth.
Speedier execution and speedier sales, strong revenue visibilty
Mahindra Lifespace
1,721
419
522
24.5
in short-to-long run, attractive valuations
We expect the company to report strong growth on back of
healthy growth in domestic branded sales (owing to
Mirza International
1,080
90
113
25.9
aggressive ad spend and addition in the number of EBOs &
multi-brand outlets [MBOs]) and healthy export revenues.
Massive capacity expansion along with rail advantage at ICD
Navkar Corporation
2,825
198
265
33.8
as well CFS augurs well for the company.
Strong brands and distribution network would boost growth
Siyaram Silk Mills
1,430
1,525
1,714
12.4
going ahead. Stock currently trades at an inexpensive
valuation.
Market leadership in Hindi news genre and no. 2 viewership
ranking in English news genre, exit from the radio business,
TV Today Network
2,001
336
385
14.8
and anticipated growth in ad spends by corporates to benefit
the stock.
Source: Company, Angel Research
Market Outlook
November 8, 2016
Key Upcoming Events
Result Calendar
Date
Company
November 08, 2016 Bharat Forge, Ashok Leyland, BHEL, Vesuvius India, UFO Moviez
November 09, 2016 Apollo Tyres, Ramco Cements, Rural Elec.Corp., BPCL, ITD Cementation, Lupin
Motherson Sumi, Thermax, Blue Star, Page Industries, Bajaj Electrical, Finolex Cables, Elecon Engineering,
November 10, 2016
Sun Pharma, Team Lease Serv.
Source: Bloomberg, Angel Research
Global economic events release calendar
Bloomberg Data
Date
Time
Country
Event Description
Unit
Period
Last Reported
Estimated
Nov 08, 2016
China
Exports YoY%
% Change Oct
(10.00)
(6.00)
3:00 PM
UK
Industrial Production (YoY)
% Change Sep
0.70
0.80
Nov 09, 2016
7:00 PM
US
Initial Jobless claims
Thousands
Nov 5
265.00
260.00
Nov 10, 2016
7:00 AM
China
Consumer Price Index (YoY)
% Change Oct
1.90
2.10
India
Imports YoY%
% Change Oct
(2.50)
7:30 AM
China
Industrial Production (YoY)
% Change Oct
6.10
6.20
Nov 11, 2016
India
Exports YoY%
% Change Oct
4.60
Nov 14, 2016
5:30 PM
India
Industrial Production YoY
% Change Sep
(0.70)
0.60
12:00 PM
India
Monthly Wholesale Prices YoY%
% Change Oct
3.57
Nov 15, 2016
3:30 PM Euro Zone
Euro-Zone GDP s.a. (QoQ)
% Change 3Q P
0.30
3:00 PM
UK
CPI (YoY)
% Change Oct
1.00
12:30 PM Germany
GDP nsa (YoY)
% Change 3Q P
3.10
Nov 16, 2016
3:00 PM
UK
Jobless claims change
% Change Oct
0.70
7:45 PM
US
Industrial Production
% Oct
0.06
0.20
US
Producer Price Index (mom)
% Change Oct
0.80
Nov 17, 2016
7:00 PM
US
Housing Starts
Thousands Oct
1,047.00
1,165.00
7:00 PM
US
Building permits
Thousands Oct
1,225.00
1,190.00
3:30 PM Euro Zone
Euro-Zone CPI (YoY)
% Oct F
0.50
7:00 PM
US Consumer price index (mom)
% Change Oct
0.30
0.40
Source: Bloomberg, Angel Research
Market Outlook
November 08, 2016
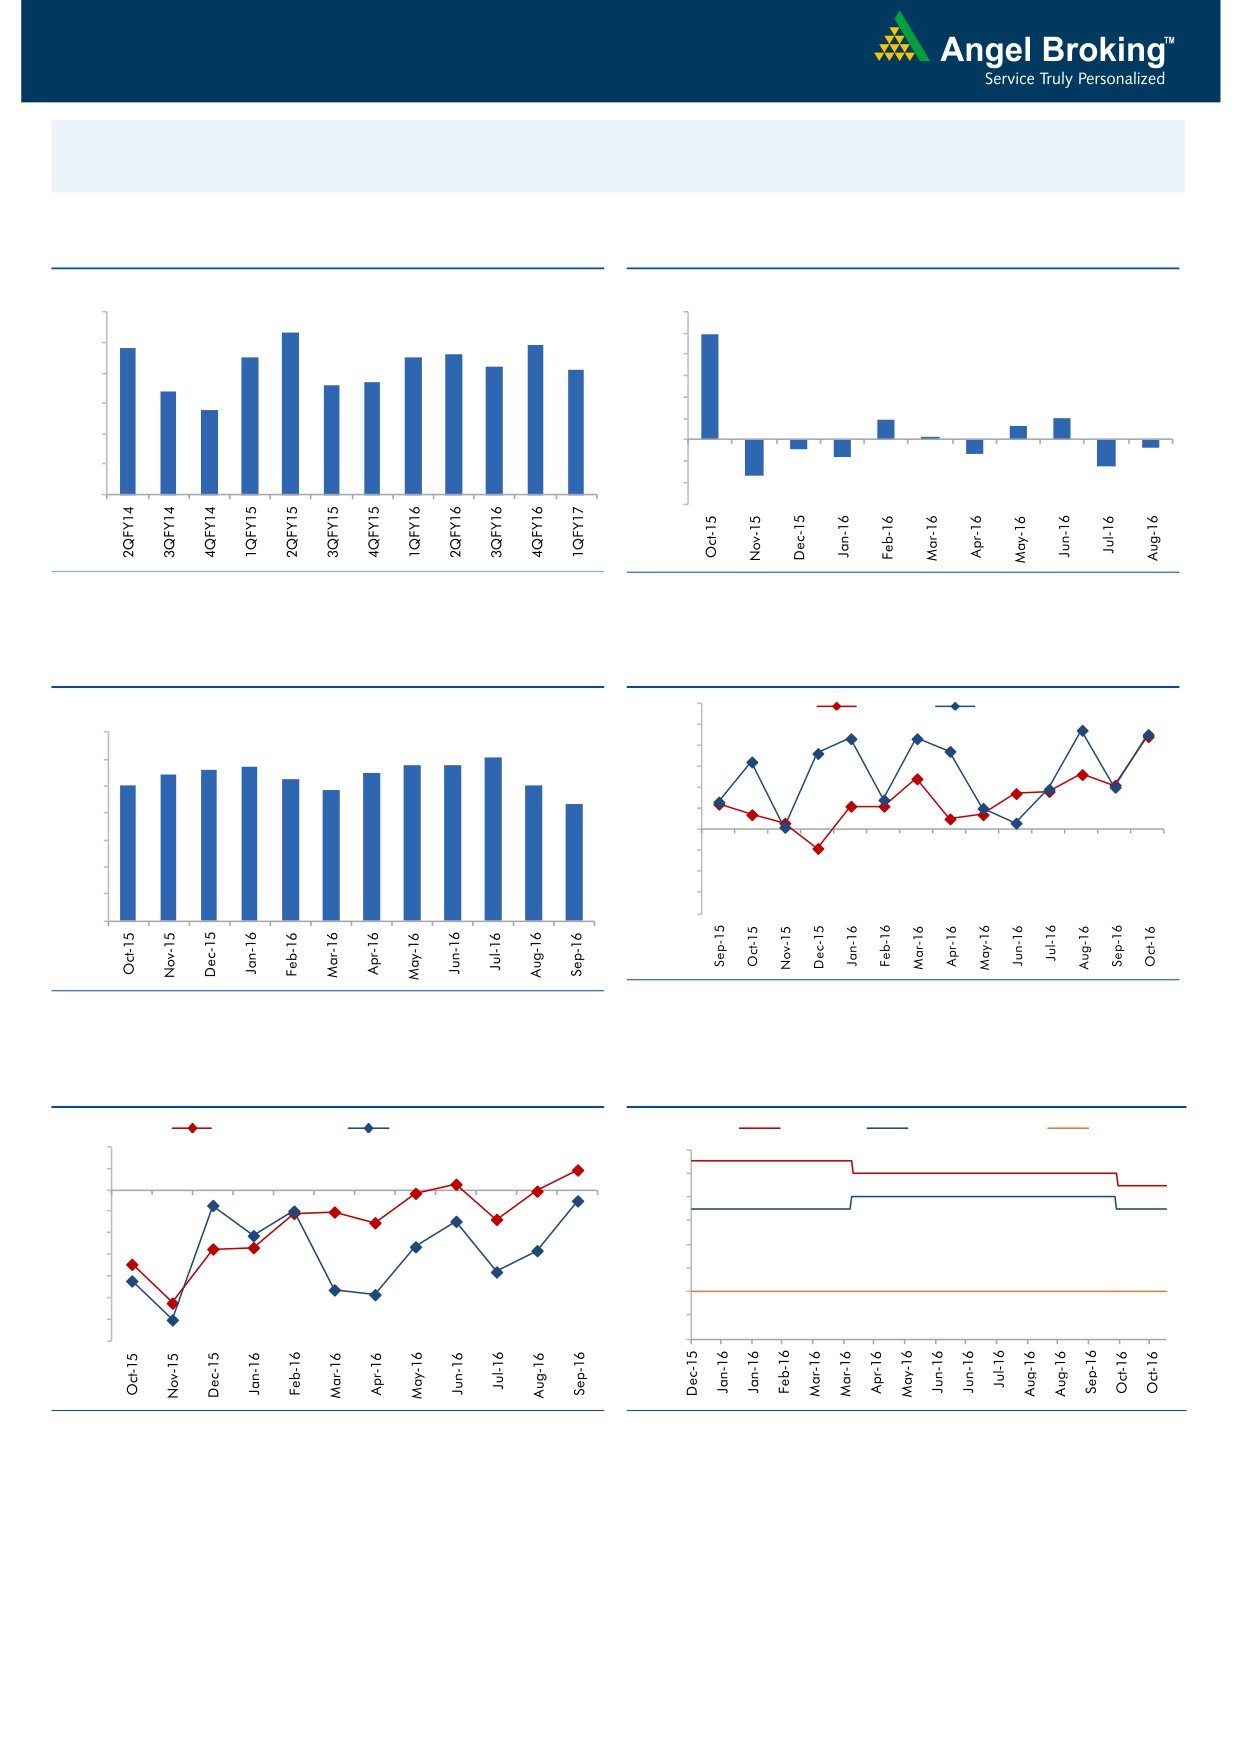
Macro watch
Exhibit 1: Quarterly GDP trends
Exhibit 2: IIP trends
(%)
(%)
9.0
12.0
8.3
9.9
7.8
7.9
10.0
8.0
7.5
7.5
7.6
7.2
7.1
8.0
6.6
6.7
7.0
6.4
6.0
5.8
6.0
4.0
1.9
2.0
1.3
2.0
0.3
5.0
-
4.0
(2.0)
(0.7)
(0.9)
(1.3)
(1.6)
(4.0)
(2.5)
3.0
(3.4)
(6.0)
Source: CSO, Angel Research
Source: MOSPI, Angel Research
Exhibit 3: Monthly CPI inflation trends
Exhibit 4: Manufacturing and services PMI
56.0
Mfg. PMI
Services PMI
(%)
55.0
7.0
6.1
54.0
5.6
5.7
5.8
5.8
6.0
5.4
5.5
5.0
5.3
5.1
53.0
4.8
5.0
4.3
52.0
4.0
51.0
50.0
3.0
49.0
2.0
48.0
1.0
47.0
46.0
-
Source: Market, Angel Research; Note: Level above 50 indicates expansion
Source: MOSPI, Angel Research
Exhibit 5: Exports and imports growth trends
Exhibit 6: Key policy rates
(%)
Exports yoy growth
Imports yoy growth
(%)
Repo rate
Reverse Repo rate
CRR
10.0
7.00
5.0
6.50
0.0
6.00
(5.0)
5.50
(10.0)
5.00
(15.0)
4.50
(20.0)
4.00
(25.0)
(30.0)
3.50
(35.0)
3.00
Source: Bloomberg, Angel Research
Source: RBI, Angel Research
Stock Watch
November 08, 2016
Company Name
Reco
CMP
Target
Mkt Cap
Sales ( Čcr )
OPM(%)
EPS (Č)
PER(x)
P/BV(x)
RoE(%)
EV/Sales(x)
(Č)
Price ( Č)
( Č cr )
FY17E FY18E
FY17E
FY18E
FY17E
FY18E
FY17E
FY18E
FY17E
FY18E
FY17E
FY18E
FY17E
FY18E
Agri / Agri Chemical
Rallis
Neutral
203
-
3,951
1,937
2,164
13.3
14.3
9.0
11.0
22.6
18.5
3.9
3.4
18.4
19.8
2.1
1.8
United Phosphorus
Neutral
667
-
33,809
15,176
17,604
18.5
18.5
37.4
44.6
17.8
15.0
3.5
2.9
21.4
21.2
2.3
2.0
Auto & Auto Ancillary
Ashok Leyland
Buy
90
111
25,513
22,407
26,022
10.6
10.6
5.2
6.4
17.2
14.0
3.9
3.3
23.6
24.7
1.2
1.0
Bajaj Auto
Neutral
2,828
-
81,836
25,093
27,891
19.5
19.2
143.9
162.5
19.7
17.4
5.5
4.7
30.3
29.4
3.0
2.6
Bharat Forge
Neutral
858
-
19,980
7,726
8,713
20.5
21.2
35.3
42.7
24.3
20.1
4.5
4.1
18.9
20.1
2.6
2.3
Eicher Motors
Neutral
24,022
-
65,245
16,583
20,447
17.5
18.0
598.0
745.2
40.2
32.2
13.7
10.5
41.2
38.3
3.8
3.0
Gabriel India
Accumulate
122
130
1,755
1,544
1,715
9.0
9.3
5.4
6.3
22.6
19.4
4.3
3.8
18.9
19.5
1.1
1.0
Hero Motocorp
Accumulate
3,350
3,541
66,898
30,958
34,139
15.7
15.7
193.6
208.3
17.3
16.1
6.8
5.6
34.2
30.5
2.0
1.8
Jamna Auto Industries Neutral
216
-
1,723
1,486
1,620
9.8
9.9
15.0
17.2
14.4
12.5
3.1
2.7
21.8
21.3
1.2
1.1
L G Balakrishnan & Bros Neutral
651
-
1,021
1,302
1,432
11.6
11.9
43.7
53.0
14.9
12.3
2.1
1.9
13.8
14.2
0.9
0.8
Mahindra and Mahindra Neutral
1,378
-
85,555
46,534
53,077
11.6
11.7
67.3
78.1
20.5
17.7
3.3
2.9
15.4
15.8
1.8
1.6
Maruti
Neutral
5,721
-
172,811
68,057
82,958
15.8
15.5
212.1
261.2
27.0
21.9
5.3
4.4
19.8
20.3
2.2
1.7
Minda Industries
Neutral
385
-
3,056
2,728
3,042
9.0
9.1
68.2
86.2
5.7
4.5
1.3
1.0
23.8
24.3
1.2
1.0
Motherson Sumi
Neutral
315
-
44,270
45,896
53,687
7.8
8.3
13.0
16.1
24.2
19.6
7.8
6.2
34.7
35.4
1.0
0.9
Rane Brake Lining
Neutral
1,002
-
793
511
562
11.3
11.5
28.1
30.9
35.7
32.4
5.4
4.9
15.3
15.0
1.7
1.6
Setco Automotive
Neutral
41
-
543
741
837
13.0
13.0
15.2
17.0
2.7
2.4
0.4
0.4
15.8
16.3
1.1
1.0
Tata Motors
Neutral
507
-
146,468
300,209
338,549
8.9
8.4
42.7
54.3
11.9
9.4
1.9
1.6
15.6
17.2
0.6
0.5
TVS Motor
Neutral
390
-
18,533
13,390
15,948
6.9
7.1
12.8
16.5
30.6
23.6
7.6
6.0
26.3
27.2
1.4
1.2
Amara Raja Batteries
Buy
1,016
1,218
17,346
5,429
6,471
17.5
17.6
35.3
43.5
28.8
23.3
6.6
5.4
25.3
24.8
3.1
2.5
Exide Industries
Neutral
193
-
16,435
7,439
8,307
15.0
15.0
8.1
9.3
23.9
20.8
3.3
3.0
14.3
16.7
1.8
1.6
Apollo Tyres
Buy
194
235
9,860
12,877
14,504
14.3
13.9
21.4
23.0
9.0
8.4
1.4
1.2
16.4
15.2
0.9
0.9
Ceat
Buy
1,221
1,450
4,937
7,524
8,624
13.0
12.7
131.1
144.3
9.3
8.5
1.7
1.5
19.8
18.6
0.7
0.6
JK Tyres
Neutral
139
-
3,161
7,455
8,056
15.0
15.0
21.8
24.5
6.4
5.7
1.3
1.1
22.8
21.3
0.6
0.5
Swaraj Engines
Neutral
1,390
-
1,727
660
810
15.2
16.4
54.5
72.8
25.5
19.1
8.0
7.2
31.5
39.2
2.4
2.0
Subros
Neutral
166
-
998
1,488
1,681
11.7
11.9
6.4
7.2
26.0
23.2
2.8
2.5
10.8
11.4
0.9
0.8
Indag Rubber
Neutral
184
-
482
286
326
19.8
16.8
11.7
13.3
15.7
13.8
2.7
2.5
17.8
17.1
1.4
1.2
Capital Goods
ACE
Neutral
52
-
515
709
814
4.1
4.6
1.4
2.1
37.2
24.8
1.5
1.5
4.4
6.0
0.9
0.8
BEML
Neutral
887
-
3,692
3,451
4,055
6.3
9.2
31.4
57.9
28.2
15.3
1.7
1.5
6.3
10.9
1.2
1.0
Bharat Electronics
Accumulate
1,302
1,414
31,248
8,137
9,169
16.8
17.2
58.7
62.5
22.2
20.8
3.4
3.1
44.6
46.3
2.8
2.5
Stock Watch
November 08, 2016
Company Name
Reco
CMP
Target
Mkt Cap
Sales ( Čcr )
OPM(%)
EPS (Č)
PER(x)
P/BV(x)
RoE(%)
EV/Sales(x)
(Č)
Price ( Č)
( Č cr )
FY17E
FY18E
FY17E
FY18E
FY17E
FY18E
FY17E
FY18E
FY17E
FY18E
FY17E
FY18E
FY17E
FY18E
Capital Goods
Voltas
Accumulate
359
407
11,874
6,511
7,514
7.9
8.7
12.9
16.3
27.8
22.0
5.0
4.4
16.7
18.5
1.6
1.3
BGR Energy
Neutral
116
-
834
16,567
33,848
6.0
5.6
7.8
5.9
14.8
19.6
0.9
0.8
4.7
4.2
0.2
0.1
BHEL
Neutral
139
-
34,058
28,797
34,742
-
2.8
2.3
6.9
60.5
20.2
1.0
1.0
1.3
4.8
0.8
0.6
Blue Star
Buy
540
634
5,153
4,283
5,077
5.9
7.3
14.9
22.1
36.3
24.4
7.1
5.9
20.4
26.4
1.3
1.1
Crompton Greaves
Neutral
86
-
5,377
5,777
6,120
5.9
7.0
3.3
4.5
26.0
19.1
1.1
1.1
4.4
5.9
0.9
0.8
Greaves Cotton
Neutral
134
-
3,269
1,755
1,881
16.8
16.9
7.8
8.5
17.2
15.8
3.4
3.2
20.6
20.9
1.6
1.4
Inox Wind
Neutral
205
-
4,539
5,605
6,267
15.7
16.4
24.8
30.0
8.3
6.8
2.3
1.7
25.9
24.4
0.9
0.7
KEC International
Neutral
126
-
3,239
9,294
10,186
7.9
8.1
9.9
11.9
12.7
10.6
1.9
1.6
15.6
16.3
0.6
0.5
Thermax
Neutral
849
-
10,115
5,421
5,940
7.3
7.3
25.7
30.2
33.0
28.1
4.0
3.7
12.2
13.1
1.8
1.6
VATech Wabag
Buy
468
681
2,549
3,136
3,845
8.9
9.1
26.0
35.9
18.0
13.0
2.3
1.9
13.4
15.9
0.7
0.6
Cement
ACC
Neutral
1,486
-
27,914
11,225
13,172
13.2
16.9
44.5
75.5
33.4
19.7
3.2
2.9
11.2
14.2
2.5
2.1
Ambuja Cements
Neutral
242
-
47,983
9,350
10,979
18.2
22.5
5.8
9.5
41.7
25.4
3.5
3.1
10.2
12.5
5.1
4.4
India Cements
Neutral
152
-
4,657
4,364
4,997
18.5
19.2
7.9
11.3
19.2
13.4
1.4
1.3
8.0
8.5
1.8
1.6
JK Cement
Neutral
904
-
6,321
4,398
5,173
15.5
17.5
31.2
55.5
29.0
16.3
3.5
3.0
12.0
15.5
2.0
1.7
J K Lakshmi Cement
Buy
468
565
5,501
2,913
3,412
14.5
19.5
7.5
22.5
62.3
20.8
3.8
3.2
12.5
18.0
2.5
2.1
Orient Cement
Buy
170
215
3,483
2,114
2,558
18.5
20.5
8.1
11.3
21.0
15.0
3.1
2.6
9.0
14.0
2.3
1.8
UltraTech Cement
Neutral
3,909
-
107,270
25,768
30,385
21.0
23.5
111.0
160.0
35.2
24.4
4.5
3.9
13.5
15.8
4.3
3.5
Construction
ITNL
Neutral
101
-
3,306
8,946
10,017
31.0
31.6
8.1
9.1
12.4
11.0
0.5
0.5
4.2
5.0
3.7
3.4
KNR Constructions
Accumulate
726
802
2,043
1,385
1,673
14.7
14.0
41.2
48.5
17.6
15.0
3.3
2.8
14.9
15.2
1.6
1.3
Larsen & Toubro
Buy
1,400
1,700
130,467
67,665
77,249
10.7
11.5
57.3
71.2
24.4
19.7
2.2
2.1
12.6
14.3
2.1
1.8
Gujarat Pipavav Port
Neutral
161
-
7,759
705
788
52.2
51.7
5.0
5.6
32.1
28.7
3.2
2.8
11.2
11.2
10.7
9.0
Nagarjuna Const.
Neutral
86
-
4,787
8,842
9,775
9.1
8.8
5.3
6.4
16.3
13.5
1.3
1.2
8.2
9.1
0.7
0.6
PNC Infratech
Buy
117
143
2,991
2,350
2,904
13.1
13.2
9.0
8.8
13.0
13.3
0.5
0.4
15.9
13.9
1.4
1.1
Simplex Infra
Neutral
326
-
1,614
6,829
7,954
10.5
10.5
31.4
37.4
10.4
8.7
1.1
1.0
9.9
13.4
0.7
0.6
Power Mech Projects
Neutral
483
-
711
1,801
2,219
12.7
14.6
72.1
113.9
6.7
4.2
1.2
1.0
16.8
11.9
0.4
0.3
Sadbhav Engineering
Accumulate
267
298
4,580
3,598
4,140
10.3
10.6
9.0
11.9
29.7
22.4
3.1
2.7
9.9
11.9
1.6
1.3
NBCC
Neutral
234
-
14,064
7,428
9,549
7.9
8.6
8.2
11.0
28.6
21.3
1.4
1.1
28.2
28.7
1.6
1.2
MEP Infra
Neutral
40
-
653
1,877
1,943
30.6
29.8
3.0
4.2
13.4
9.6
6.5
4.4
0.6
0.6
1.7
1.6
SIPL
Neutral
101
-
3,543
1,036
1,252
65.5
66.2
(8.4)
(5.6)
3.8
4.3
(22.8)
(15.9)
11.6
9.7
Stock Watch
November 08, 2016
Company Name
Reco
CMP
Target
Mkt Cap
Sales ( Čcr )
OPM(%)
EPS (Č)
PER(x)
P/BV(x)
RoE(%)
EV/Sales(x)
(Č)
Price ( Č)
( Č cr )
FY17E
FY18E
FY17E
FY18E
FY17E
FY18E
FY17E
FY18E
FY17E
FY18E
FY17E
FY18E
FY17E
FY18E
Construction
Engineers India
Neutral
251
-
8,460
1,725
1,935
16.0
19.1
11.4
13.9
22.0
18.1
3.0
2.9
13.4
15.3
3.8
3.4
Financials
Axis Bank
Buy
484
630
115,615
46,932
53,575
3.5
3.4
32.4
44.6
15.0
10.9
1.9
1.7
13.6
16.5
-
-
Bank of Baroda
Neutral
148
-
34,113
19,980
23,178
1.8
1.8
11.5
17.3
12.9
8.6
1.5
1.2
8.3
10.1
-
-
Canara Bank
Neutral
299
-
16,241
15,225
16,836
1.8
1.8
14.5
28.0
20.6
10.7
1.4
1.2
5.8
8.5
-
-
Dewan Housing Finance Accumulate
312
350
9,773
2,225
2,688
2.9
2.9
29.7
34.6
10.5
9.0
1.7
1.5
16.1
16.8
-
-
Equitas Holdings
Buy
171
235
5,730
939
1,281
11.7
11.5
5.8
8.2
29.5
20.8
2.5
2.3
10.9
11.5
-
-
Federal Bank
Neutral
77
-
13,264
9,353
10,623
2.9
2.9
4.4
5.8
17.6
13.3
1.7
1.5
9.5
11.0
-
-
HDFC
Neutral
1,379
-
218,086
11,475
13,450
3.4
3.4
45.3
52.5
30.5
26.3
5.9
5.2
20.2
20.5
-
-
HDFC Bank
Accumulate
1,250
1,350
316,442
46,097
55,433
4.5
4.5
58.4
68.0
21.4
18.4
3.8
3.1
18.8
18.6
-
-
ICICI Bank
Neutral
279
-
162,209
39,029
45,903
3.3
3.3
16.7
16.3
16.7
17.1
2.1
1.9
10.1
12.4
-
-
LIC Housing Finance
Buy
543
630
27,426
3,712
4,293
2.6
2.5
39.0
46.0
13.9
11.8
2.6
2.2
19.9
20.1
-
-
Punjab Natl.Bank
Neutral
140
-
29,845
23,532
23,595
2.3
2.4
6.8
12.6
20.6
11.1
3.2
2.3
3.3
6.5
-
-
RBL Bank
Neutral
383
-
14,171
1,783
2,309
2.6
2.6
12.7
16.4
30.2
23.4
3.3
2.9
12.8
13.3
-
-
South Ind.Bank
Neutral
23
-
3,106
6,435
7,578
2.5
2.5
2.7
3.1
8.5
7.4
1.1
0.9
10.1
11.2
-
-
St Bk of India
Neutral
253
-
196,165
88,650
98,335
2.6
2.6
13.5
18.8
18.7
13.4
1.8
1.6
7.0
8.5
-
-
Union Bank
Neutral
133
-
9,157
13,450
14,925
2.3
2.3
25.5
34.5
5.2
3.9
0.8
0.7
7.5
10.2
-
-
Yes Bank
Neutral
1,206
-
50,770
8,978
11,281
3.3
3.4
74.0
90.0
16.3
13.4
3.1
2.6
17.0
17.2
-
-
FMCG
Asian Paints
Neutral
1,038
-
99,531
17,128
18,978
16.8
16.4
19.1
20.7
54.3
50.1
18.9
17.8
34.8
35.5
5.7
5.2
Britannia
Accumulate
3,303
3,626
39,630
9,795
11,040
14.6
14.9
80.3
94.0
41.1
35.1
16.9
13.1
41.2
-
3.9
3.4
Colgate
Neutral
977
-
26,583
4,605
5,149
23.4
23.4
23.8
26.9
41.1
36.3
22.7
17.8
64.8
66.8
5.7
5.1
Dabur India
Neutral
297
-
52,211
8,315
9,405
19.8
20.7
8.1
9.2
36.6
32.3
10.2
8.5
31.6
31.0
5.9
5.2
GlaxoSmith Con*
Neutral
5,747
-
24,170
4,350
4,823
21.2
21.4
179.2
196.5
32.1
29.3
8.5
7.2
27.1
26.8
4.9
4.4
Godrej Consumer
Neutral
1,521
-
51,809
10,235
11,428
18.4
18.6
41.1
44.2
37.0
34.4
8.2
6.9
24.9
24.8
5.1
4.5
HUL
Neutral
838
-
181,396
35,252
38,495
17.8
17.8
20.7
22.4
40.6
37.4
38.8
33.3
95.6
88.9
5.0
4.6
ITC
Accumulate
257
284
309,858
40,059
44,439
38.3
39.2
9.0
10.1
28.6
25.3
8.0
7.0
27.8
27.5
7.2
6.5
Marico
Buy
260
300
33,480
6,430
7,349
18.8
19.5
6.4
7.7
40.6
33.7
12.2
10.3
33.2
32.5
5.0
4.3
Nestle*
Neutral
6,527
-
62,931
10,073
11,807
20.7
21.5
124.8
154.2
52.3
42.3
21.5
19.3
34.8
36.7
6.1
5.1
Tata Global
Neutral
128
-
8,078
8,675
9,088
9.8
9.8
7.4
8.2
17.3
15.6
2.0
1.9
7.9
8.1
0.9
0.8
Procter & Gamble
Accumulate
6,900
7,369
22,398
2,939
3,342
23.2
23.0
146.2
163.7
47.2
42.2
105.7
101.3
25.3
23.5
7.2
6.2
Hygiene
Stock Watch
November 08, 2016
Company Name
Reco
CMP
Target
Mkt Cap
Sales ( Čcr )
OPM(%)
EPS (Č)
PER(x)
P/BV(x)
RoE(%)
EV/Sales(x)
(Č)
Price ( Č)
( Č cr )
FY17E FY18E
FY17E
FY18E
FY17E
FY18E
FY17E
FY18E
FY17E
FY18E
FY17E
FY18E
FY17E
FY18E
IT
HCL Tech^
Buy
815
1,000
114,948
49,242
57,168
20.5
20.5
55.7
64.1
14.6
12.7
3.0
2.3
20.3
17.9
2.2
1.8
Infosys
Buy
979
1,249
224,813
68,350
77,326
27.0
27.0
62.5
69.4
15.7
14.1
3.3
3.1
21.3
21.6
2.7
2.4
TCS
Accumulate
2,279
2,620
449,130
119,025
133,308
27.6
27.6
131.2
145.5
17.4
15.7
5.6
5.2
32.4
33.1
3.6
3.1
Tech Mahindra
Buy
445
600
43,172
29,673
32,937
15.5
17.0
32.8
39.9
13.6
11.2
2.7
2.3
19.6
20.7
1.2
1.0
Wipro
Buy
451
590
109,614
55,440
60,430
18.1
18.1
35.9
39.9
12.6
11.3
2.2
2.1
19.0
19.3
1.7
1.6
Media
D B Corp
Neutral
379
-
6,955
2,297
2,590
27.4
28.2
21.0
23.4
18.0
16.2
4.2
3.6
23.7
23.1
2.8
2.4
HT Media
Neutral
81
-
1,886
2,693
2,991
12.6
12.9
7.9
9.0
10.3
9.0
0.9
0.8
7.8
8.3
0.3
0.2
Jagran Prakashan
Buy
186
225
6,092
2,355
2,635
28.0
28.0
10.8
12.5
17.3
14.9
3.7
3.2
21.7
21.7
2.6
2.3
Sun TV Network
Neutral
528
-
20,804
2,850
3,265
70.1
71.0
26.2
30.4
20.2
17.4
5.2
4.6
24.3
25.6
6.9
5.9
Hindustan Media
Neutral
294
-
2,156
1,016
1,138
24.3
25.2
27.3
30.1
10.8
9.8
2.0
1.8
16.2
15.8
1.4
1.3
Ventures
TV Today Network
Accumulate
336
385
2,001
637
743
27.5
27.5
18.4
21.4
18.3
15.7
3.2
2.7
17.4
17.2
2.8
2.3
Metals & Mining
Coal India
Neutral
319
-
201,334
84,638
94,297
21.4
22.3
24.5
27.1
13.0
11.8
5.4
5.2
42.6
46.0
1.9
1.7
Hind. Zinc
Neutral
263
-
110,915
14,252
18,465
55.9
48.3
15.8
21.5
16.6
12.2
2.7
2.4
17.0
20.7
7.8
6.0
Hindalco
Neutral
168
-
34,589
107,899
112,095
7.4
8.2
9.2
13.0
18.2
12.9
0.9
0.8
4.8
6.6
0.8
0.8
JSW Steel
Neutral
1,601
-
38,697
53,201
58,779
16.1
16.2
130.6
153.7
12.3
10.4
1.7
1.4
14.0
14.4
1.5
1.3
NMDC
Neutral
127
-
50,451
6,643
7,284
44.4
47.7
7.1
7.7
17.9
16.5
1.6
1.5
8.8
9.2
5.4
4.8
SAIL
Neutral
51
-
21,063
47,528
53,738
(0.7)
2.1
(1.9)
2.6
19.6
0.6
0.5
(1.6)
3.9
1.3
1.2
Vedanta
Neutral
216
-
63,963
71,744
81,944
19.2
21.7
13.4
20.1
16.1
10.7
1.4
1.2
8.4
11.3
1.3
1.0
Tata Steel
Neutral
412
-
39,966
121,374
121,856
7.2
8.4
18.6
34.3
22.1
12.0
1.4
1.3
6.1
10.1
1.0
0.9
Oil & Gas
Cairn India
Neutral
242
-
45,437
9,127
10,632
4.3
20.6
8.8
11.7
27.5
20.7
0.9
0.9
3.3
4.2
6.4
5.4
GAIL
Neutral
426
-
54,075
56,220
65,198
9.3
10.1
27.1
33.3
15.7
12.8
1.4
1.3
9.3
10.7
1.2
1.0
ONGC
Neutral
267
-
228,731
137,222
152,563
15.0
21.8
19.5
24.1
13.7
11.1
1.2
1.1
8.5
10.1
1.9
1.7
Indian Oil Corp
Neutral
316
-
153,325
373,359
428,656
5.9
5.5
54.0
59.3
5.9
5.3
0.9
0.8
16.0
15.6
0.6
0.5
Reliance Industries
Neutral
1,002
-
324,877
301,963
358,039
12.1
12.6
87.7
101.7
11.4
9.9
1.2
1.1
10.7
11.3
1.6
1.3
Pharmaceuticals
Alembic Pharma
Neutral
657
-
12,384
3,483
4,083
20.2
21.4
24.3
30.4
27.0
21.6
6.2
4.9
25.5
25.3
3.5
2.9
Aurobindo Pharma
Accumulate
767
877
44,859
15,720
18,078
23.7
23.7
41.4
47.3
18.5
16.2
4.8
3.8
29.6
26.1
3.1
2.7
Aventis*
Neutral
4,254
-
9,798
2,357
2,692
17.3
17.3
153.5
169.2
27.7
25.1
4.7
3.8
25.8
28.4
3.8
3.1
Cadila Healthcare
Neutral
385
-
39,394
10,429
12,318
22.6
22.0
16.9
19.2
22.8
20.0
5.8
4.7
28.5
25.7
3.8
3.1
Cipla
Neutral
546
-
43,855
15,378
18,089
17.4
18.4
21.6
27.2
25.3
20.1
3.3
2.9
13.7
15.2
3.1
2.5
Stock Watch
November 08, 2016
Company Name
Reco
CMP
Target
Mkt Cap
Sales ( Čcr )
OPM(%)
EPS (Č)
PER(x)
P/BV(x)
RoE(%)
EV/Sales(x)
(Č)
Price ( Č)
( Č cr )
FY17E FY18E
FY17E
FY18E
FY17E
FY18E
FY17E
FY18E
FY17E
FY18E
FY17E
FY18E
FY17E
FY18E
Pharmaceuticals
Dr Reddy's
Neutral
3,099
-
51,344
16,043
18,119
20.8
22.4
112.4
142.9
27.6
21.7
3.7
3.2
14.1
15.9
3.2
2.8
Dishman Pharma
Neutral
238
-
3,842
1,718
1,890
22.7
22.8
9.5
11.3
25.1
21.1
2.4
2.2
10.1
10.9
2.7
2.4
GSK Pharma*
Neutral
2,771
-
23,473
3,528
3,811
16.6
18.8
51.8
59.4
53.5
46.7
14.3
14.3
26.3
30.6
6.4
6.0
Indoco Remedies
Neutral
280
-
2,580
1,112
1,289
18.2
18.2
13.2
15.6
21.2
18.0
3.8
3.2
19.2
19.2
2.4
2.1
Ipca labs
Accumulate
577
613
7,283
3,303
3,799
15.3
15.3
17.3
19.7
33.4
29.3
2.9
2.7
9.1
9.4
2.3
2.0
Lupin
Buy
1,519
1,809
68,501
15,912
18,644
26.4
26.7
58.1
69.3
26.2
21.9
5.1
4.2
21.4
20.9
4.4
3.6
Sun Pharma
Buy
657
944
158,180
31,129
35,258
30.0
30.9
28.0
32.8
23.5
20.0
3.6
3.0
18.7
18.9
4.7
3.9
Power
Tata Power
Neutral
75
-
20,379
36,916
39,557
17.4
27.1
5.1
6.3
14.8
12.0
1.3
1.2
9.0
10.3
1.6
1.4
NTPC
Neutral
155
-
127,970
86,605
95,545
17.5
20.8
11.8
13.4
13.2
11.6
1.3
1.3
10.5
11.1
2.8
2.8
Power Grid
Neutral
174
-
91,082
25,763
29,762
74.3
73.1
14.8
17.3
11.8
10.1
1.8
1.6
16.9
17.5
7.8
7.4
Real Estate
Prestige Estate
Buy
182
210
6,819
4,707
5,105
25.2
26.0
10.3
13.0
17.7
14.0
1.4
1.3
10.3
10.2
2.6
2.3
MLIFE
Buy
419
522
1,721
1,152
1,300
22.7
24.6
29.9
35.8
14.0
11.7
1.0
1.0
7.6
8.6
2.2
1.9
Telecom
Bharti Airtel
Neutral
305
-
122,041
105,086
114,808
34.5
34.7
12.2
16.4
25.0
18.6
1.7
1.6
6.8
8.4
2.1
1.8
Idea Cellular
Neutral
73
-
26,358
40,133
43,731
37.2
37.1
6.4
6.5
11.4
11.3
1.0
0.9
8.2
7.6
1.7
1.4
zOthers
Abbott India
Neutral
4,738
-
10,069
3,153
3,583
14.1
14.4
152.2
182.7
31.1
25.9
152.9
130.5
25.6
26.1
2.9
2.5
Asian Granito
Buy
264
351
796
1,071
1,182
12.1
12.4
12.7
16.0
20.8
16.6
2.0
1.8
9.5
10.7
1.0
0.9
Bajaj Electricals
Buy
249
306
2,518
5,099
5,805
5.6
5.9
11.4
14.6
21.9
17.1
2.9
2.6
13.4
15.1
0.5
0.4
Banco Products (India)
Neutral
209
-
1,491
1,353
1,471
12.3
12.4
14.5
16.3
14.4
12.8
19.9
17.9
14.5
14.6
1.0
111.8
Coffee Day Enterprises
Neutral
218
-
4,492
2,964
3,260
20.5
21.2
4.7
8.0
-
27.3
2.5
2.3
5.5
8.5
1.9
1.7
Ltd
Competent Automobiles Neutral
186
-
115
1,137
1,256
3.1
2.7
28.0
23.6
6.7
7.9
35.8
32.4
14.3
11.5
0.1
0.1
Elecon Engineering
Neutral
63
-
682
1,482
1,660
13.7
14.5
3.9
5.8
16.1
10.8
3.8
3.5
7.8
10.9
0.8
0.7
Finolex Cables
Neutral
430
-
6,583
2,883
3,115
12.0
12.1
14.2
18.6
30.3
23.1
16.1
14.1
15.8
14.6
2.0
1.8
Garware Wall Ropes
Neutral
545
-
1,193
873
938
12.9
13.1
30.9
34.9
17.6
15.6
2.8
2.4
15.7
15.2
1.3
1.2
Goodyear India*
Neutral
778
-
1,795
1,598
1,704
10.4
10.2
49.4
52.6
15.8
14.8
72.7
63.8
18.2
17.0
0.8
113.6
Hitachi
Neutral
1,437
-
3,906
2,081
2,433
8.8
8.9
33.4
39.9
43.0
36.0
34.7
28.9
22.1
21.4
1.9
1.6
HSIL
Neutral
350
-
2,534
2,384
2,515
15.8
16.3
15.3
19.4
22.9
18.1
22.8
19.6
7.8
9.3
1.2
1.1
Interglobe Aviation
Neutral
925
-
33,342
21,122
26,005
14.5
27.6
110.7
132.1
8.4
7.0
50.0
35.7
168.5
201.1
1.6
1.2
Jyothy Laboratories
Neutral
359
-
6,520
1,440
2,052
11.5
13.0
8.5
10.0
42.2
35.9
10.2
9.5
18.6
19.3
4.8
3.4
Kirloskar Engines India
Neutral
348
-
5,033
2,554
2,800
9.9
10.0
10.5
12.1
33.1
28.8
13.9
13.1
10.7
11.7
1.6
1.4
Ltd
Stock Watch
November 08, 2016
Company Name
Reco
CMP
Target
Mkt Cap
Sales ( Čcr )
OPM(%)
EPS (Č)
PER(x)
P/BV(x)
RoE(%)
EV/Sales(x)
(Č)
Price ( Č)
( Č cr )
FY17E
FY18E
FY17E
FY18E
FY17E
FY18E
FY17E
FY18E
FY17E
FY18E
FY17E
FY18E
FY17E
FY18E
zOthers
Linc Pen & Plastics
Neutral
254
-
376
382
420
9.3
9.5
13.5
15.7
18.9
16.2
3.2
2.8
17.1
17.3
1.1
0.9
M M Forgings
Neutral
443
-
534
546
608
20.4
20.7
41.3
48.7
10.7
9.1
60.6
53.6
16.6
17.0
0.8
0.7
Manpasand Bever.
Neutral
701
-
4,009
836
1,087
19.6
19.4
16.9
23.8
41.5
29.4
5.0
4.4
12.0
14.8
4.5
3.4
Mirza International
Buy
90
113
1,080
1,024
1,148
18.0
18.0
6.9
8.0
13.0
11.2
2.2
1.9
16.6
16.2
1.2
1.1
MT Educare
Neutral
136
-
542
366
417
17.7
18.2
9.4
10.8
14.5
12.6
3.2
2.8
22.2
22.3
1.4
1.2
Narayana Hrudaya
Neutral
342
-
6,983
1,873
2,166
11.5
11.7
2.6
4.0
129.2
86.2
7.9
7.2
6.1
8.3
3.8
3.3
Navkar Corporation
Buy
198
265
2,825
408
612
42.9
42.3
6.8
11.5
29.3
17.2
2.0
1.8
6.9
10.5
7.8
5.2
Navneet Education
Neutral
102
-
2,427
1,062
1,147
24.0
24.0
6.1
6.6
16.7
15.4
3.4
3.0
20.6
19.8
2.4
2.2
Nilkamal
Neutral
1,530
-
2,283
1,995
2,165
10.7
10.4
69.8
80.6
21.9
19.0
87.4
76.0
16.6
16.5
1.1
1.0
Page Industries
Neutral
15,866
-
17,696
2,450
3,124
20.1
17.6
299.0
310.0
53.1
51.2
353.4
269.7
47.1
87.5
7.3
5.7
Parag Milk Foods
Neutral
304
-
2,554
1,919
2,231
9.3
9.6
9.5
12.9
32.1
23.5
5.0
4.1
15.5
17.5
1.5
1.3
Quick Heal
Neutral
239
-
1,672
408
495
27.3
27.0
7.7
8.8
30.8
27.2
2.9
2.9
9.3
10.6
3.2
2.7
Radico Khaitan
Neutral
142
-
1,884
1,667
1,824
13.0
13.2
6.7
8.2
21.3
17.3
1.9
1.8
9.0
10.2
1.5
1.4
Relaxo Footwears
Neutral
406
-
4,879
2,085
2,469
9.2
8.2
7.6
8.0
53.8
51.1
20.8
17.8
17.9
18.8
2.4
2.1
S H Kelkar & Co.
Neutral
307
-
4,439
1,036
1,160
15.1
15.0
6.1
7.2
50.3
42.8
5.4
4.9
10.7
11.5
4.2
3.7
Siyaram Silk Mills
Accumulate
1,525
1,714
1,430
1,799
2,040
11.6
11.7
104.9
122.4
14.5
12.5
2.4
2.0
16.4
16.4
1.0
0.9
Styrolution ABS India*
Neutral
620
-
1,090
1,440
1,537
9.2
9.0
40.6
42.6
15.3
14.6
39.0
35.5
12.3
11.6
0.7
0.6
Surya Roshni
Neutral
224
-
984
3,342
3,625
7.8
7.5
17.3
19.8
13.0
11.4
24.7
19.8
10.5
10.8
0.6
0.5
Team Lease Serv.
Neutral
1,018
-
1,741
3,229
4,001
1.5
1.8
22.8
32.8
44.7
31.0
4.8
4.2
10.7
13.4
0.4
0.3
The Byke Hospitality
Neutral
184
-
738
287
384
20.5
20.5
7.6
10.7
24.2
17.2
5.1
4.1
20.7
23.5
2.6
1.9
Transport Corporation of
Neutral
187
-
1,429
2,671
2,911
8.5
8.8
13.9
15.7
13.5
11.9
1.8
1.6
13.7
13.8
0.6
0.6
India
TVS Srichakra
Neutral
3,718
-
2,847
2,304
2,614
13.7
13.8
231.1
266.6
16.1
14.0
417.8
329.0
33.9
29.3
1.2
1.1
UFO Moviez
Neutral
487
-
1,343
619
685
33.2
33.4
30.0
34.9
16.2
13.9
2.3
1.9
13.8
13.9
1.9
1.5
Visaka Industries
Neutral
222
-
352
1,051
1,138
10.3
10.4
21.0
23.1
10.5
9.6
28.4
26.6
9.0
9.2
0.6
0.6
VRL Logistics
Neutral
283
-
2,584
1,902
2,119
16.7
16.6
14.6
16.8
19.4
16.8
4.3
3.7
21.9
22.2
1.5
1.3
Wonderla Holidays
Neutral
373
-
2,107
287
355
38.0
40.0
11.3
14.2
33.0
26.3
4.7
4.1
21.4
23.9
7.0
5.7
Source: Company, Angel Research; Note: *December year end; #September year end; &October year end; Price as on November 07, 2016
Market Outlook
November 08, 2016
Research Team Tel: 022 - 39357800
DISCLAIMER
Angel Broking Private Limited (hereinafter referred to as “Angel”) is a registered Member of National Stock Exchange of India
Limited,Bombay Stock Exchange Limited and Metropolitan Stock Exchange Limited. It is also registered as a Depository Participant with
CDSL and Portfolio Manager with SEBI. It also has registration with AMFI as a Mutual Fund Distributor. Angel Broking Private Limited is a
registered entity with SEBI for Research Analyst in terms of SEBI (Research Analyst) Regulations, 2014 vide registration number
INH000000164. Angel or its associates has not been debarred/ suspended by SEBI or any other regulatory authority for accessing
/dealing in securities Market. Angel or its associates/analyst has not received any compensation / managed or
co-managed public offering of securities of the company covered by Analyst during the past twelve months.
This document is solely for the personal information of the recipient, and must not be singularly used as the basis of any investment
decision. Nothing in this document should be construed as investment or financial advice. Each recipient of this document should make
such investigations as they deem necessary to arrive at an independent evaluation of an investment in the securities of the companies
referred to in this document (including the merits and risks involved), and should consult their own advisors to determine the merits and
risks of such an investment.
Reports based on technical and derivative analysis center on studying charts of a stock's price movement, outstanding positions and
trading volume, as opposed to focusing on a company's fundamentals and, as such, may not match with a report on a company's
fundamentals. Investors are advised to refer the Fundamental and Technical Research Reports available on our website to evaluate the
contrary view, if any.
The information in this document has been printed on the basis of publicly available information, internal data and other reliable
sources believed to be true, but we do not represent that it is accurate or complete and it should not be relied on as such, as this
document is for general guidance only. Angel Broking Pvt. Limited or any of its affiliates/ group companies shall not be in any way
responsible for any loss or damage that may arise to any person from any inadvertent error in the information contained in this report.
Angel Broking Pvt. Limited has not independently verified all the information contained within this document. Accordingly, we cannot
testify, nor make any representation or warranty, express or implied, to the accuracy, contents or data contained within this document.
While Angel Broking Pvt. Limited endeavors to update on a reasonable basis the information discussed in this material, there may be
regulatory, compliance, or other reasons that prevent us from doing so.
This document is being supplied to you solely for your information, and its contents, information or data may not be reproduced,
redistributed or passed on, directly or indirectly.
Neither Angel Broking Pvt. Limited, nor its directors, employees or affiliates shall be liable for any loss or damage that may arise from
or in connection with the use of this information.